Micro AI SCADA — Industrial Monitoring Interface
Redesigned the information architecture and real-time data visualization interface for an AI-powered SCADA system managing 3,000+ device states simultaneously.
I. Summary
I led the UI/UX optimization for Microt AI's SCADA system, creating a modern, low-fatigue dark-mode dashboard tailored for high-intensity industrial monitoring. The core objective was to structure massive amounts of equipment data, allowing operators to "identify anomalies in one second" and ensure stable production line operations.
Quick Facts:
Role: Principal Enterprise Design Consultant
Platform: Desktop SCADA System
Key Outcomes: Optimized monitoring for 3000+ devices, established a SCADA-specific design system, improved alarm response speed.
Key Skills: Advanced Data Visualization, Dark Mode Interface Architecture, Scalable Industrial Component Systems.
II. Context & Challenge
The Context:
Microt AI is a provider of advanced industrial automation solutions. Their monitoring system manages thousands of devices simultaneously. The legacy interface was cluttered with disorganized data tables and lacked visual focus, causing operators to miss critical information during emergency alarms.
The Problem:
Information Overload: A single screen displayed excessive unnecessary data, lacking hierarchy.
Difficult Alarm Identification: Insufficient visual difference between abnormal and normal states delayed troubleshooting.
Visual Fatigue: Long-term exposure to high-brightness traditional industrial interfaces caused operator eye strain.
The Goals:
Visual Noise Reduction: Implementing Dark Mode with high-contrast accent colors to reduce background interference and highlight key data.
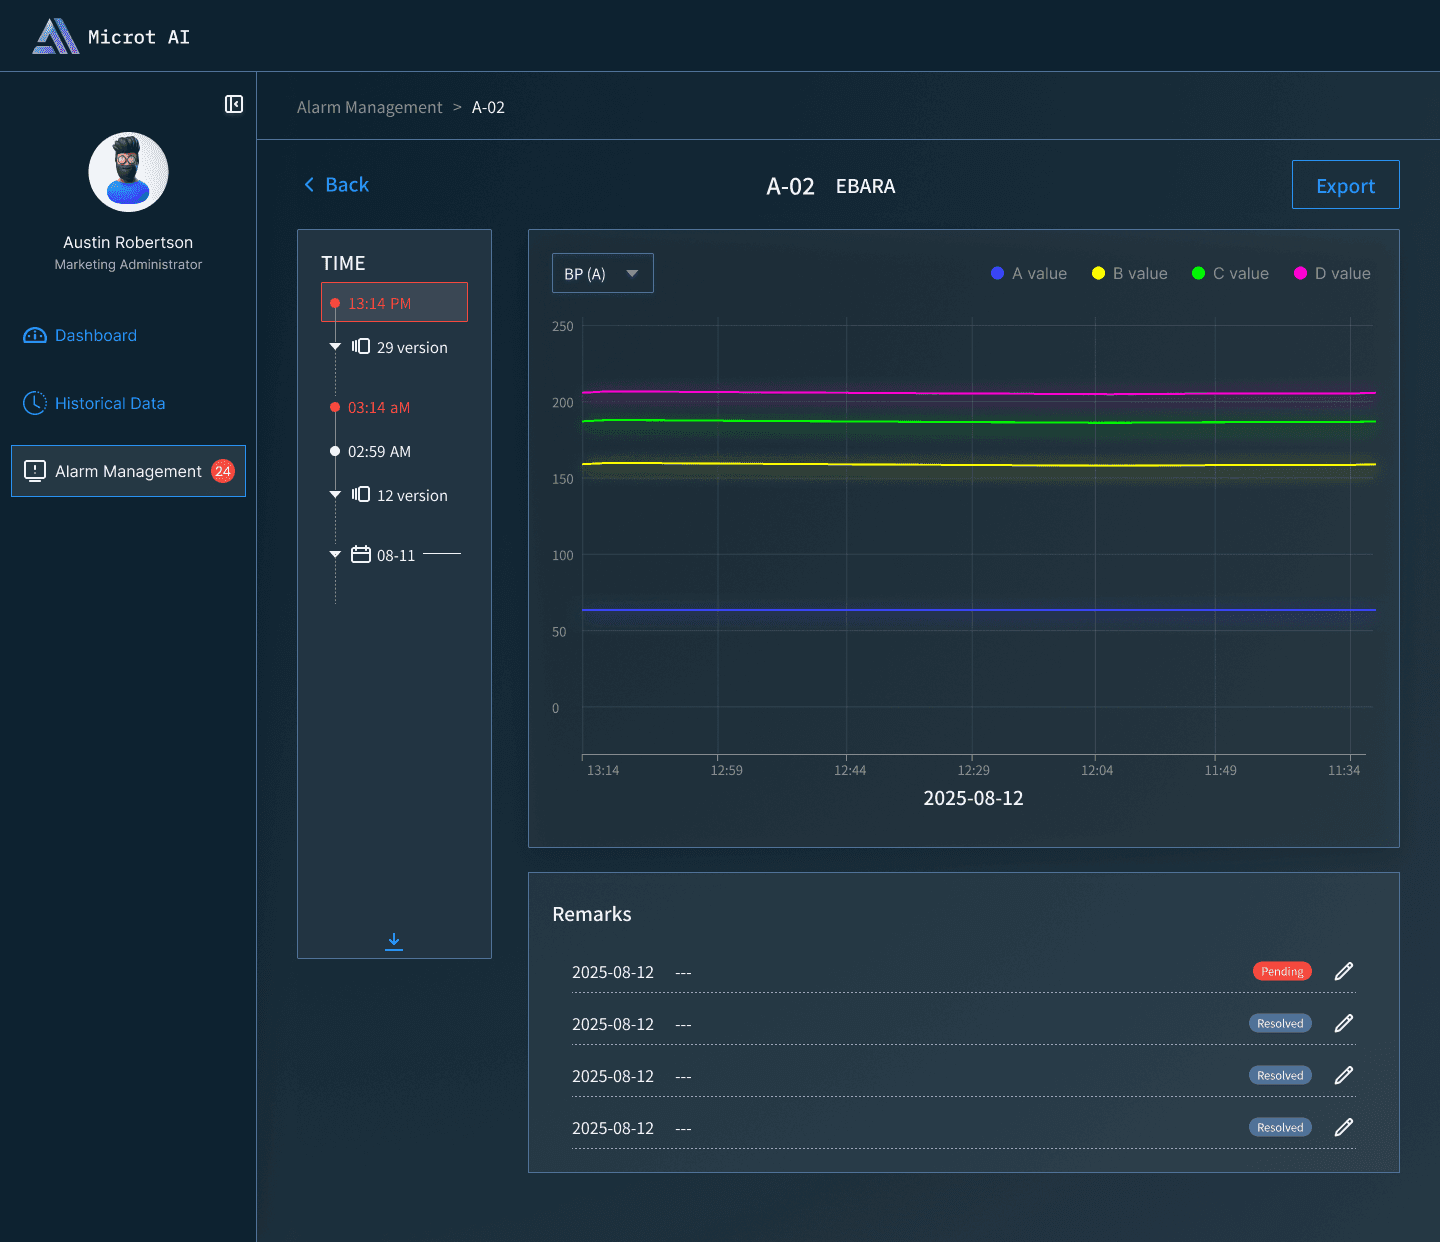
Anomaly Priority: Redesigning the alarm center to ensure "Alarm" and "Stop" states have the highest visual priority.
Modular Scalability: Building a reusable component library to accommodate future device types.
III. Design Process
The Process and Rationale
A. IA & Workflow Optimization
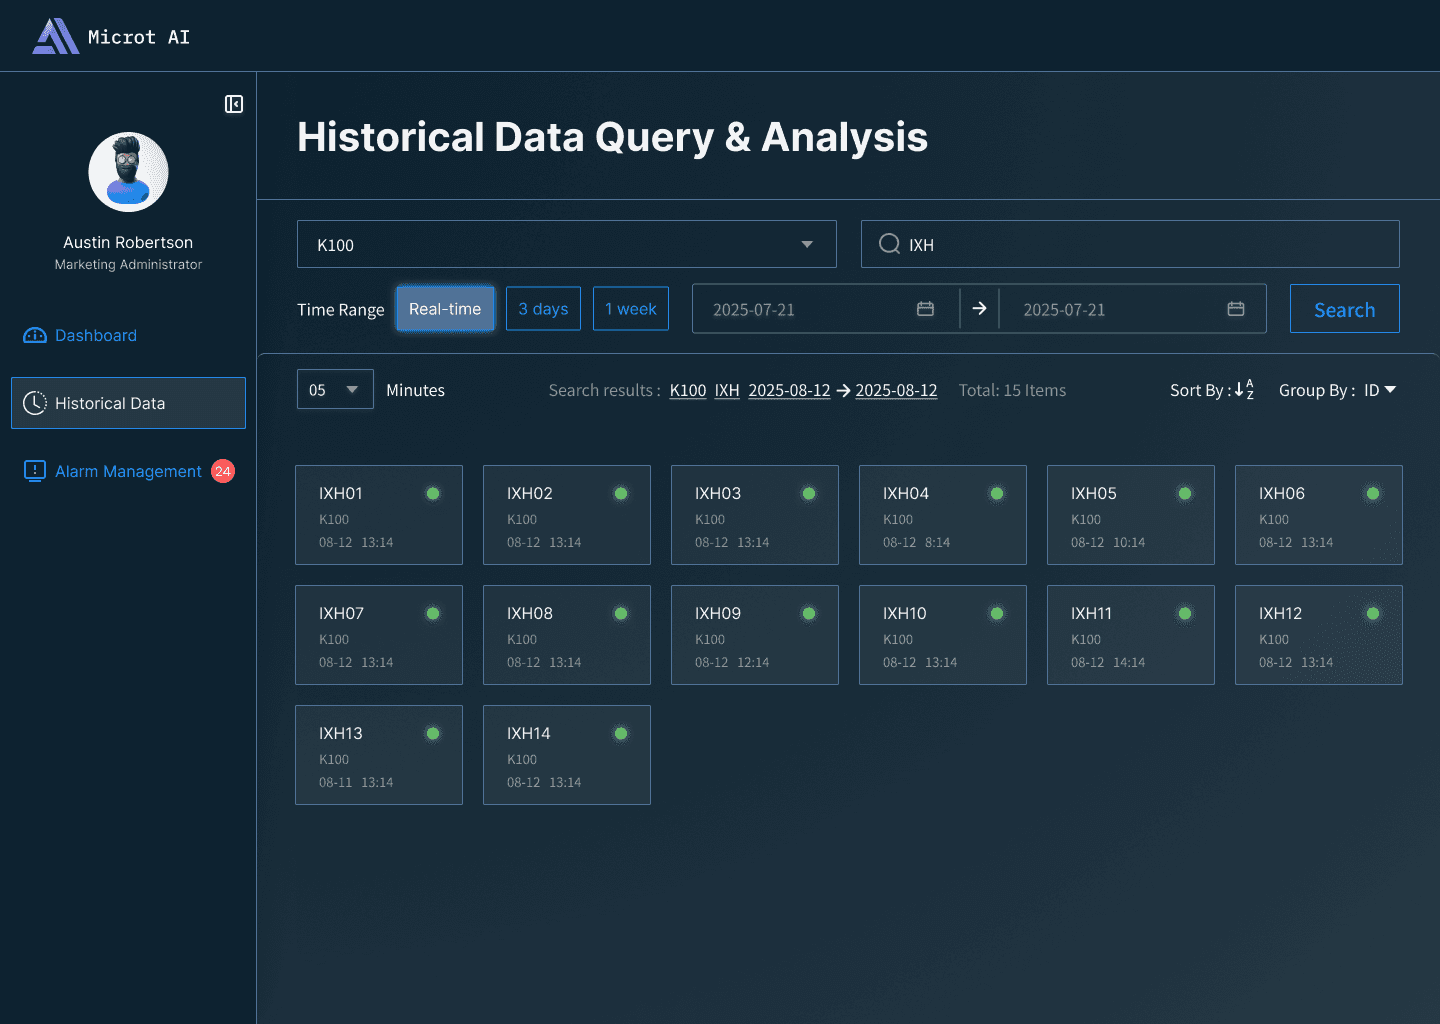
Challenge: The system monitors 3000+ devices with states like Running, Disconnected, Offline, Stop, and Alarm.
Rationale: Adopted an "Overview -> Filter -> Detail" information flow. The home dashboard only shows summary statistics; detailed lists expand upon clicking, significantly reducing cognitive load.
B. Visual Design & Dark Mode Strategy
Strategy: Considering low-light monitoring environments, we chose a deep blue-grey base (#0F172A) with high-saturation status colors (Red for Alarm, Yellow for Warning, Blue for Running).
Presentation: Used donut charts and progress bars for status distribution, making data readable at a glance.
C. SCADA-specific Design System
Engineered a high-reliability, domain-specific Enterprise Design System. Defined precise component status standards—mapping specific semantic colors to critical alert tiers (Alarm, Warning, Normal)—establishing a unified single source of truth that accelerated future module expansion and scaled smoothly across diverse industrial display hardware.